Monitor a Unit
By now, you should have your device registered and provisioned as Unit.
A Unit can be monitored in various ways through the AosCloud management UI.
Shown status information should be utilized to
- manage the health and detail status of your Unit,
- debug your device or Service implementations.
Units page
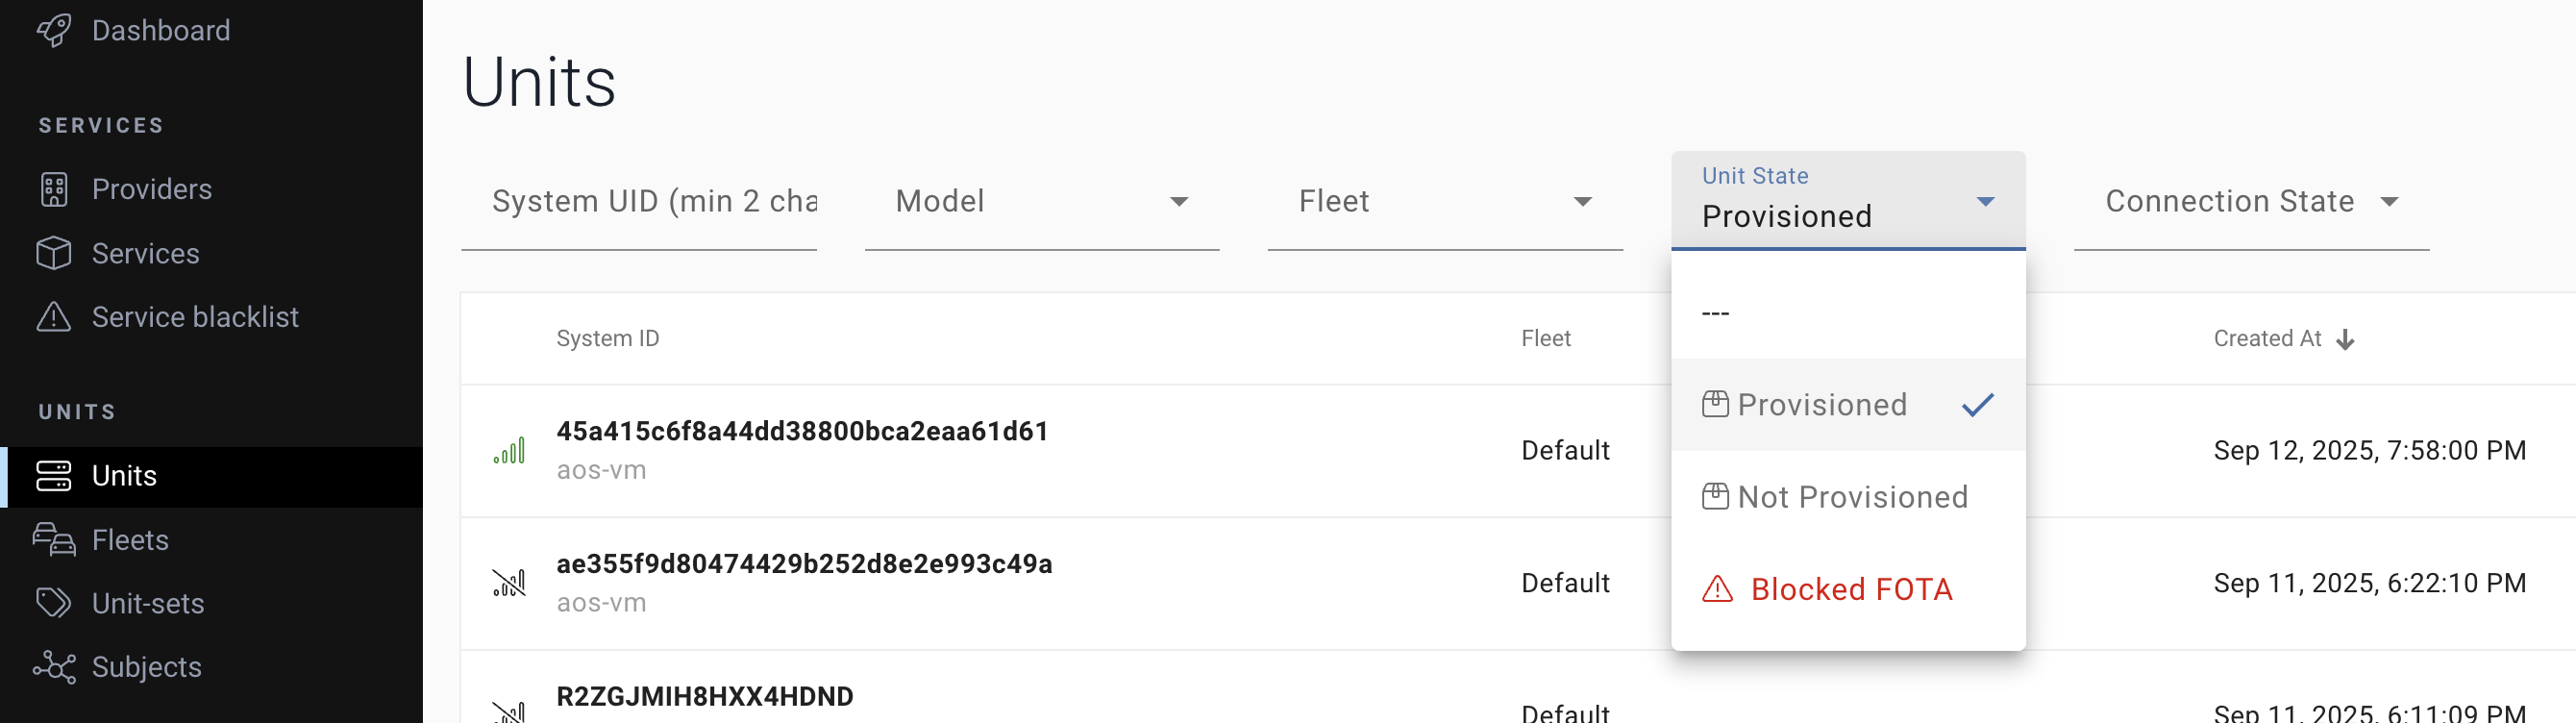
Once your device is provisioned, it should be listed in the Units page.
Connectivity status
Here, connectivity status of the Unit can be confirmed by simple icons before the Unit's System ID.
| icon | status | detail |
|---|---|---|
 | offline | No connectivity established between AosCloud and device. |
 | connected | Connection is established, but device is not fully recognized by AosCloud. |
 | online | Connection is established and device is fully recognized by AosCloud. |
Unit state
Units list can be filtered by below Unit states:
- Provisioned
- Not Provisioned
- Blocked FOTA - For some reason, initiated FOTA (Component) update was blocked.
Unit Details page
Select a Unit in the Units list to see the Unit Details page. Various detail of the Unit can be confirmed.
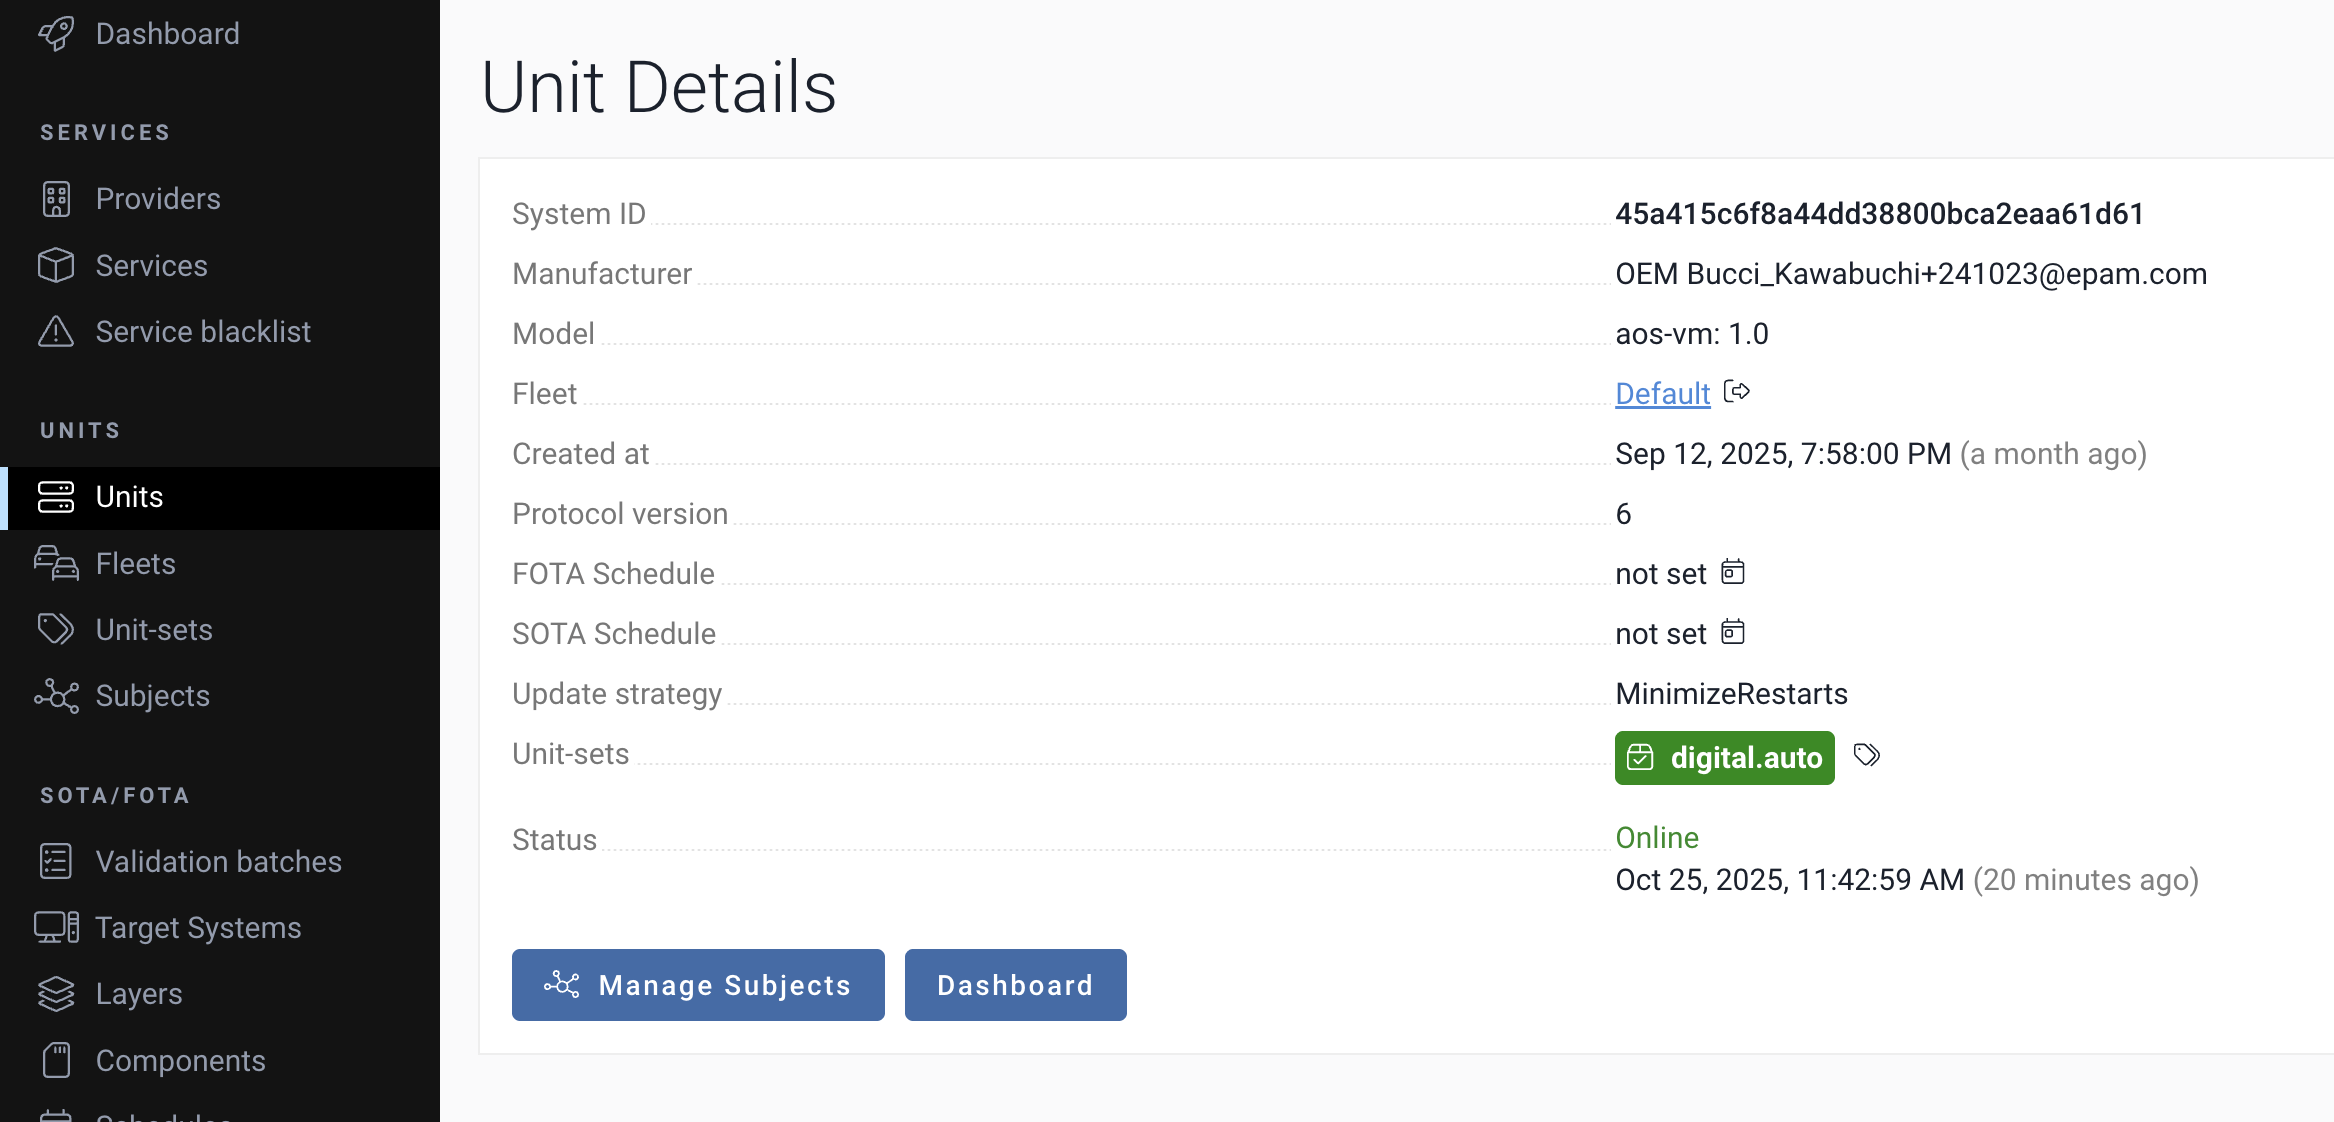
Also, in the System section, below details can be confirmed by selecting each tab.
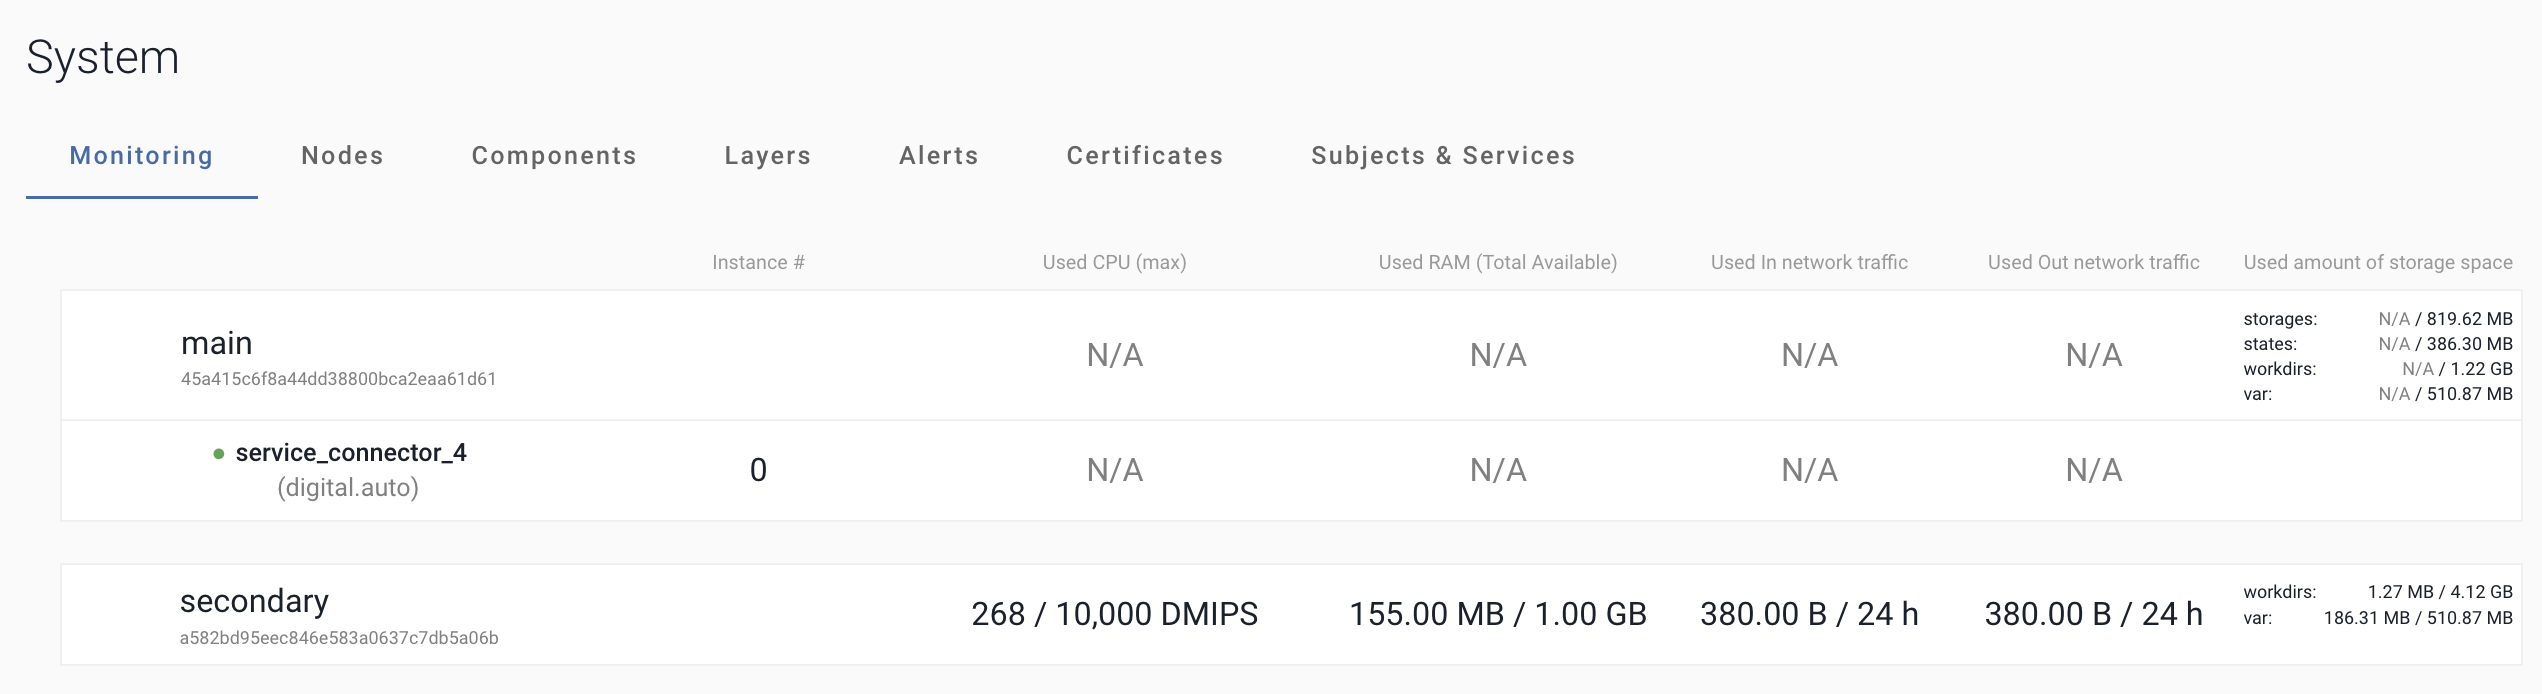
Monitoring
Resource consumption metrics for each Node of the Unit can be confirmed.
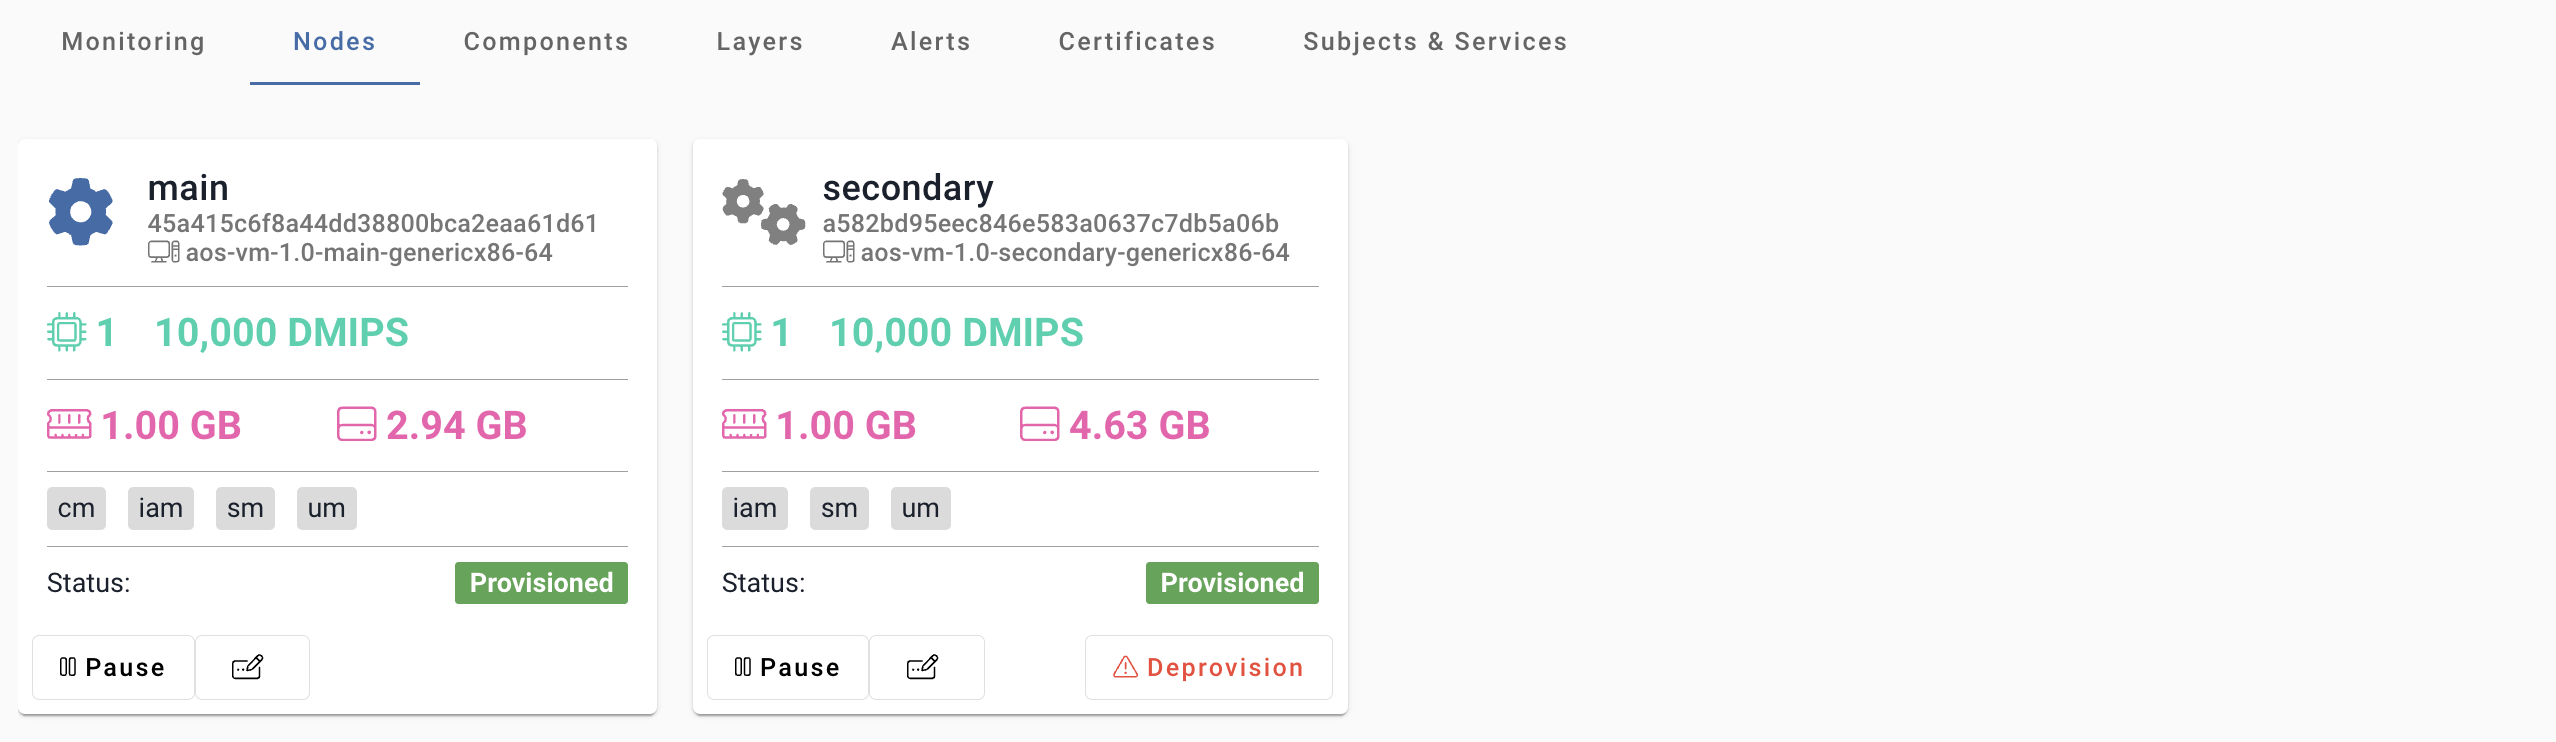
Nodes
Various details and provisioning status of nodes can be confirmed.
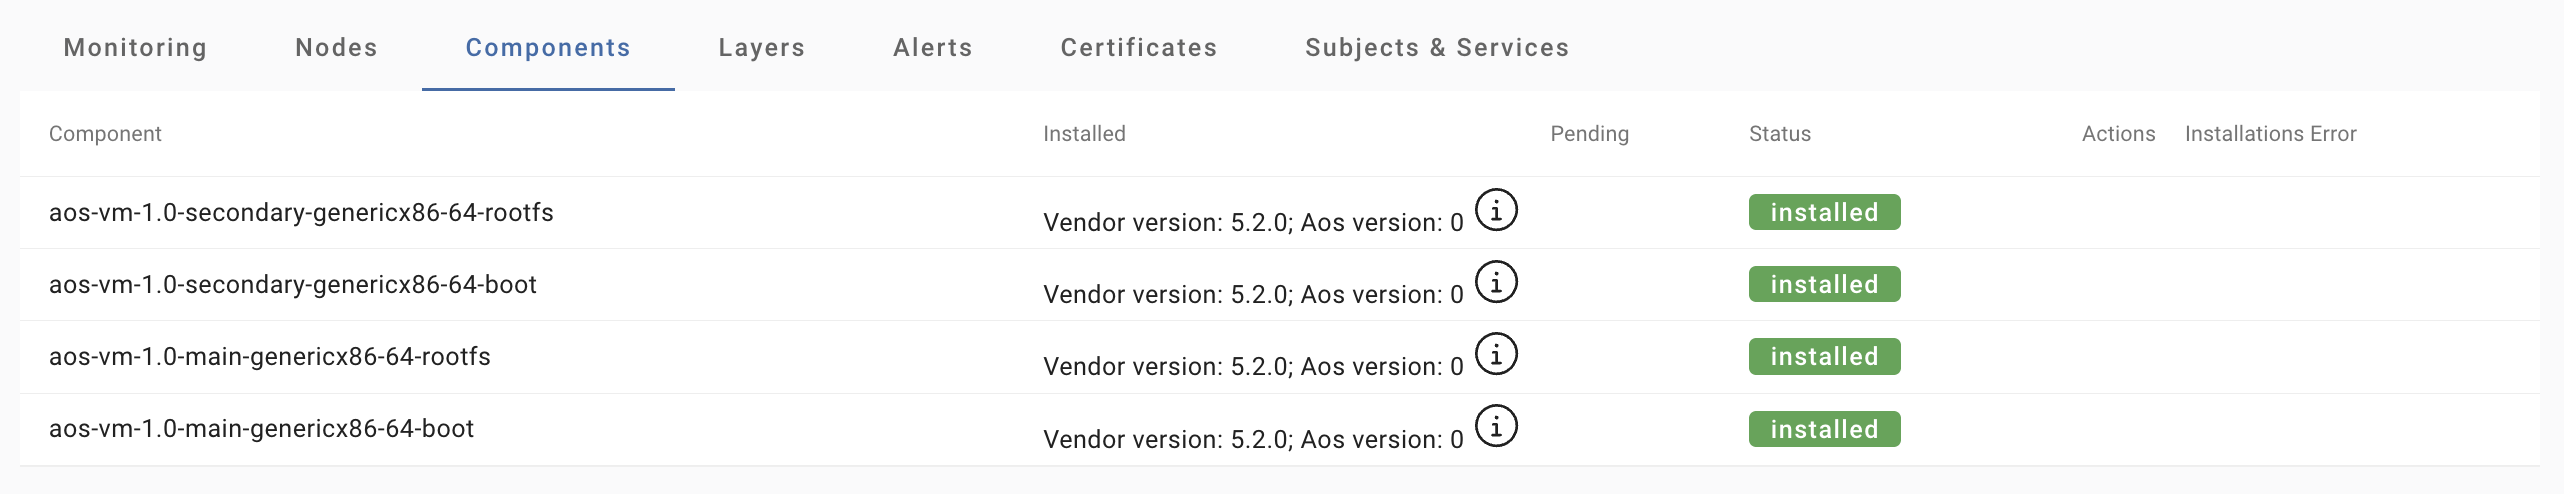
Components
Install status and errors of the Components can be confirmed.
Layers
Install status of Layers can be confirmed.

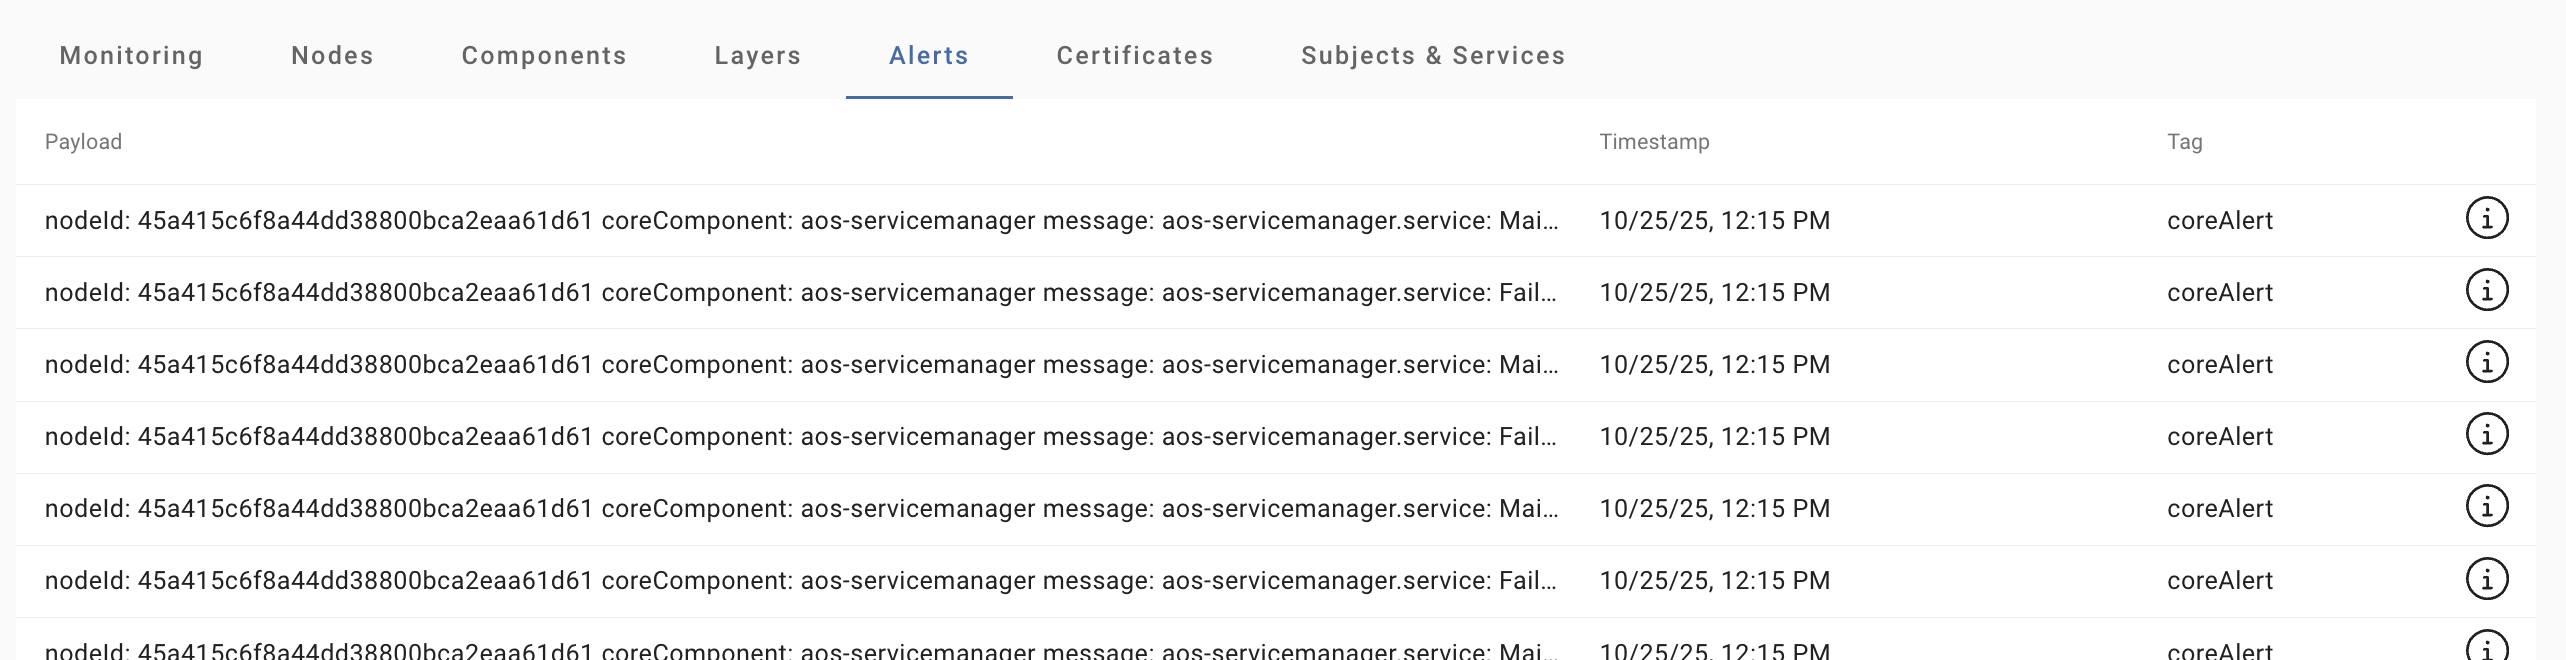
Alerts
Alerts from the Unit can be confirmed.
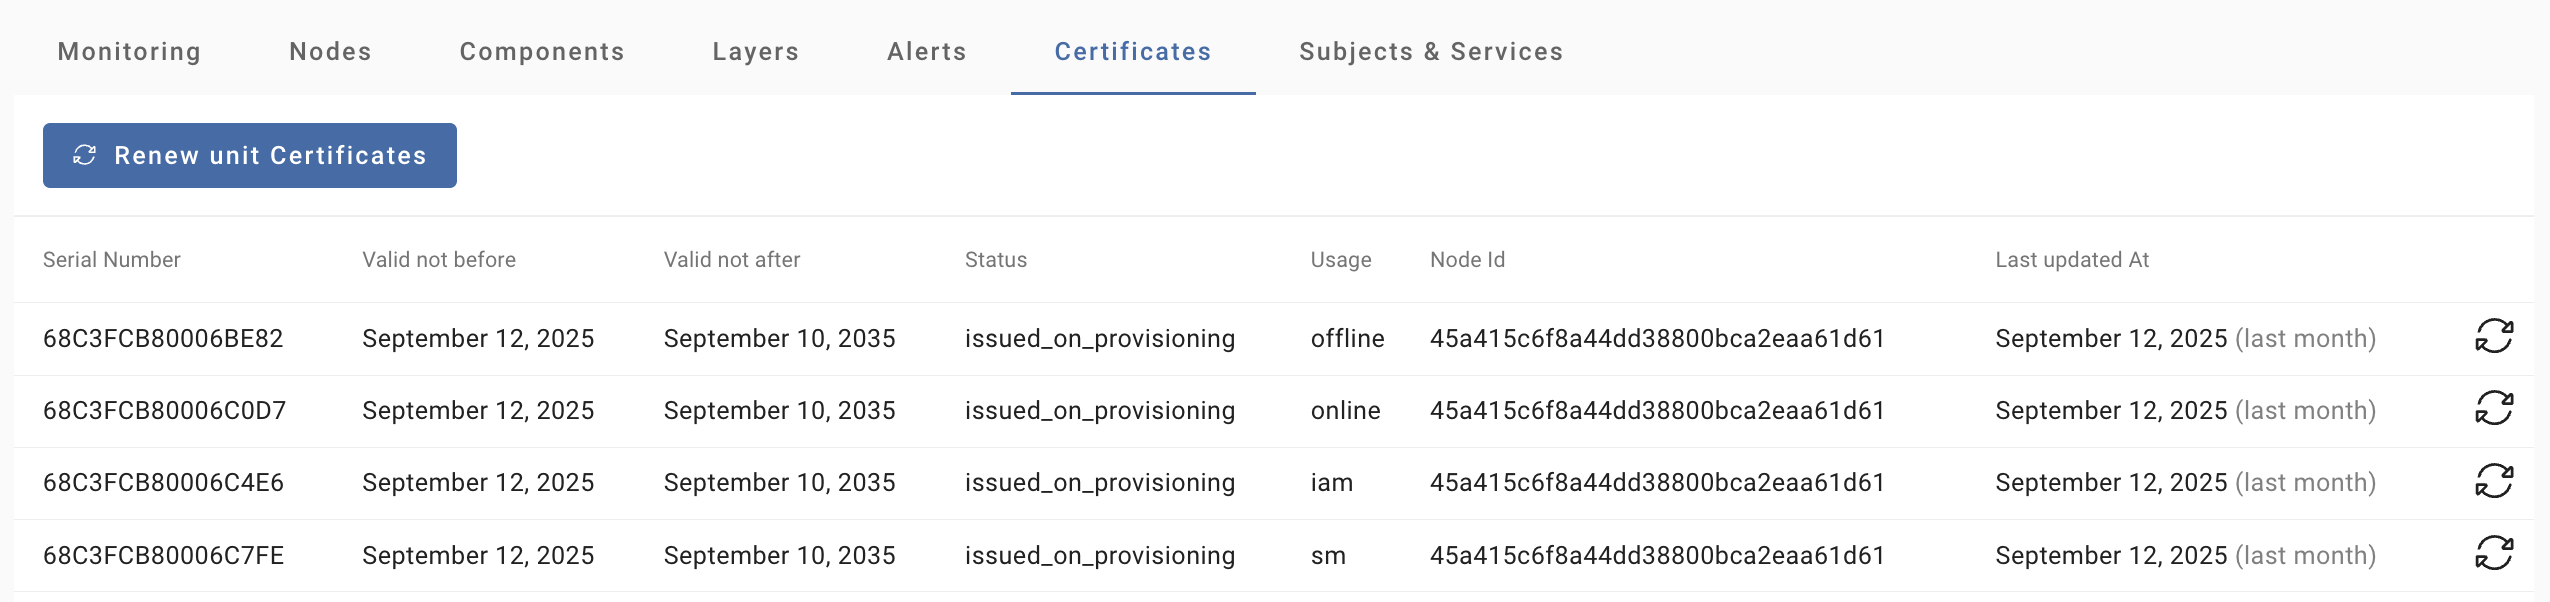
Certificates
List of installed certificates can be confirmed.
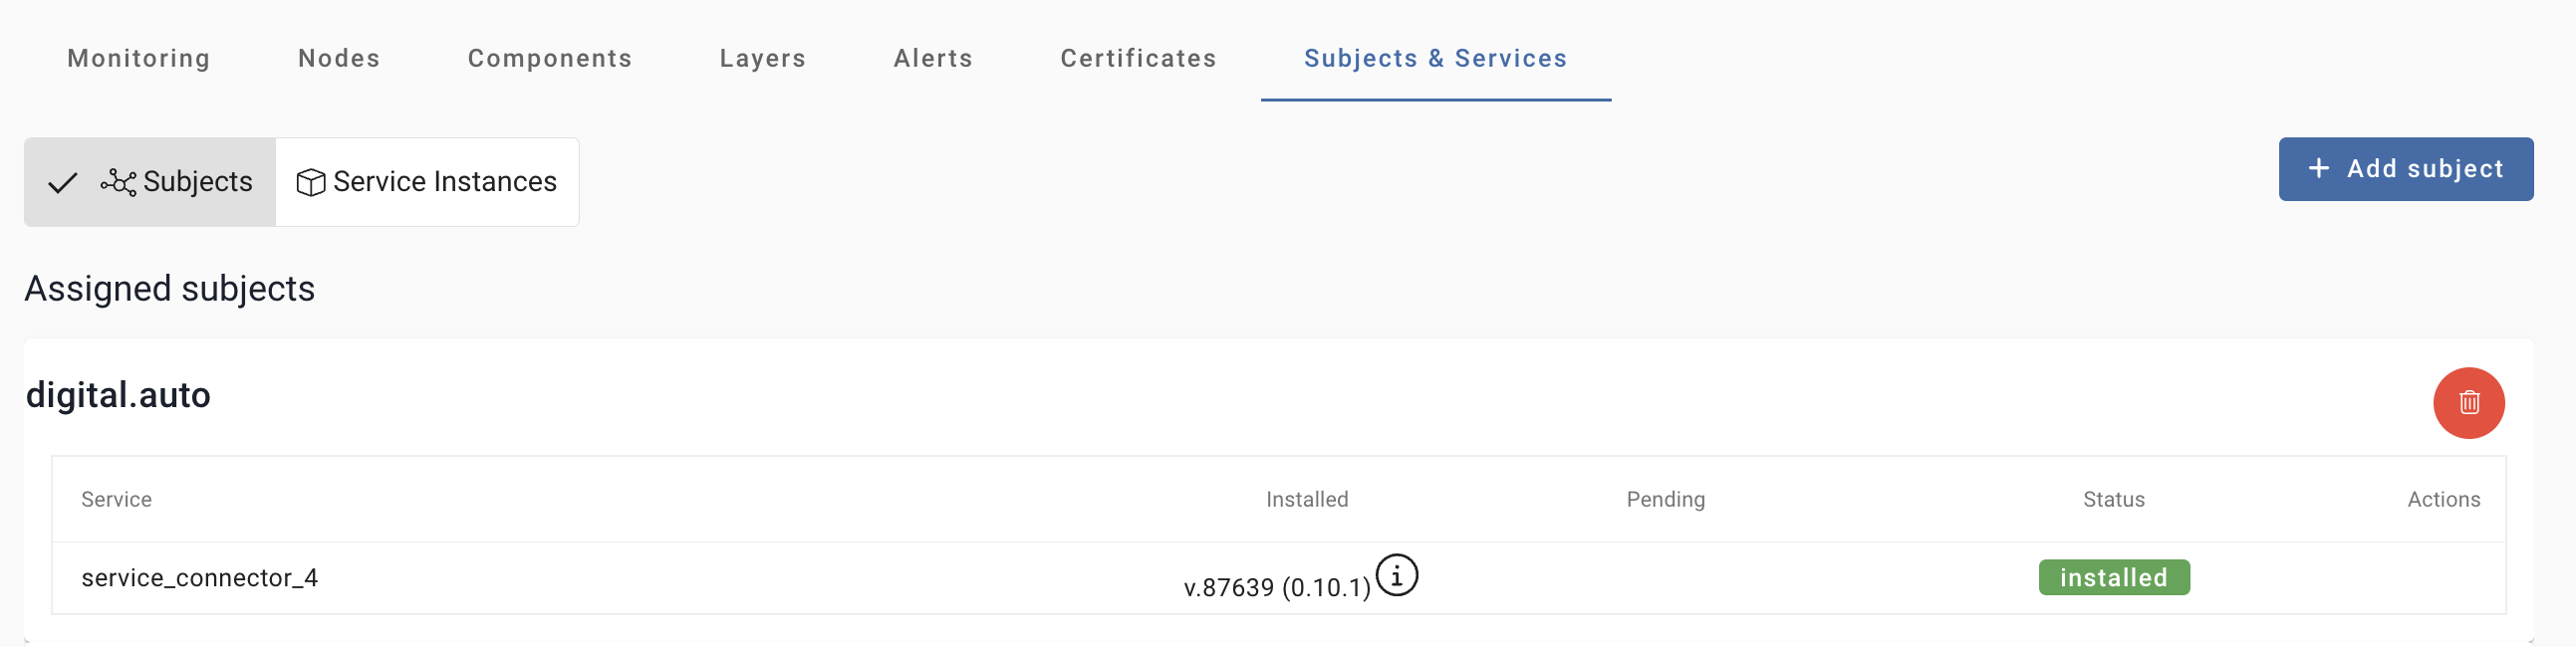
Subjects & Services
Subjects
Install status of Subjects can be confirmed.
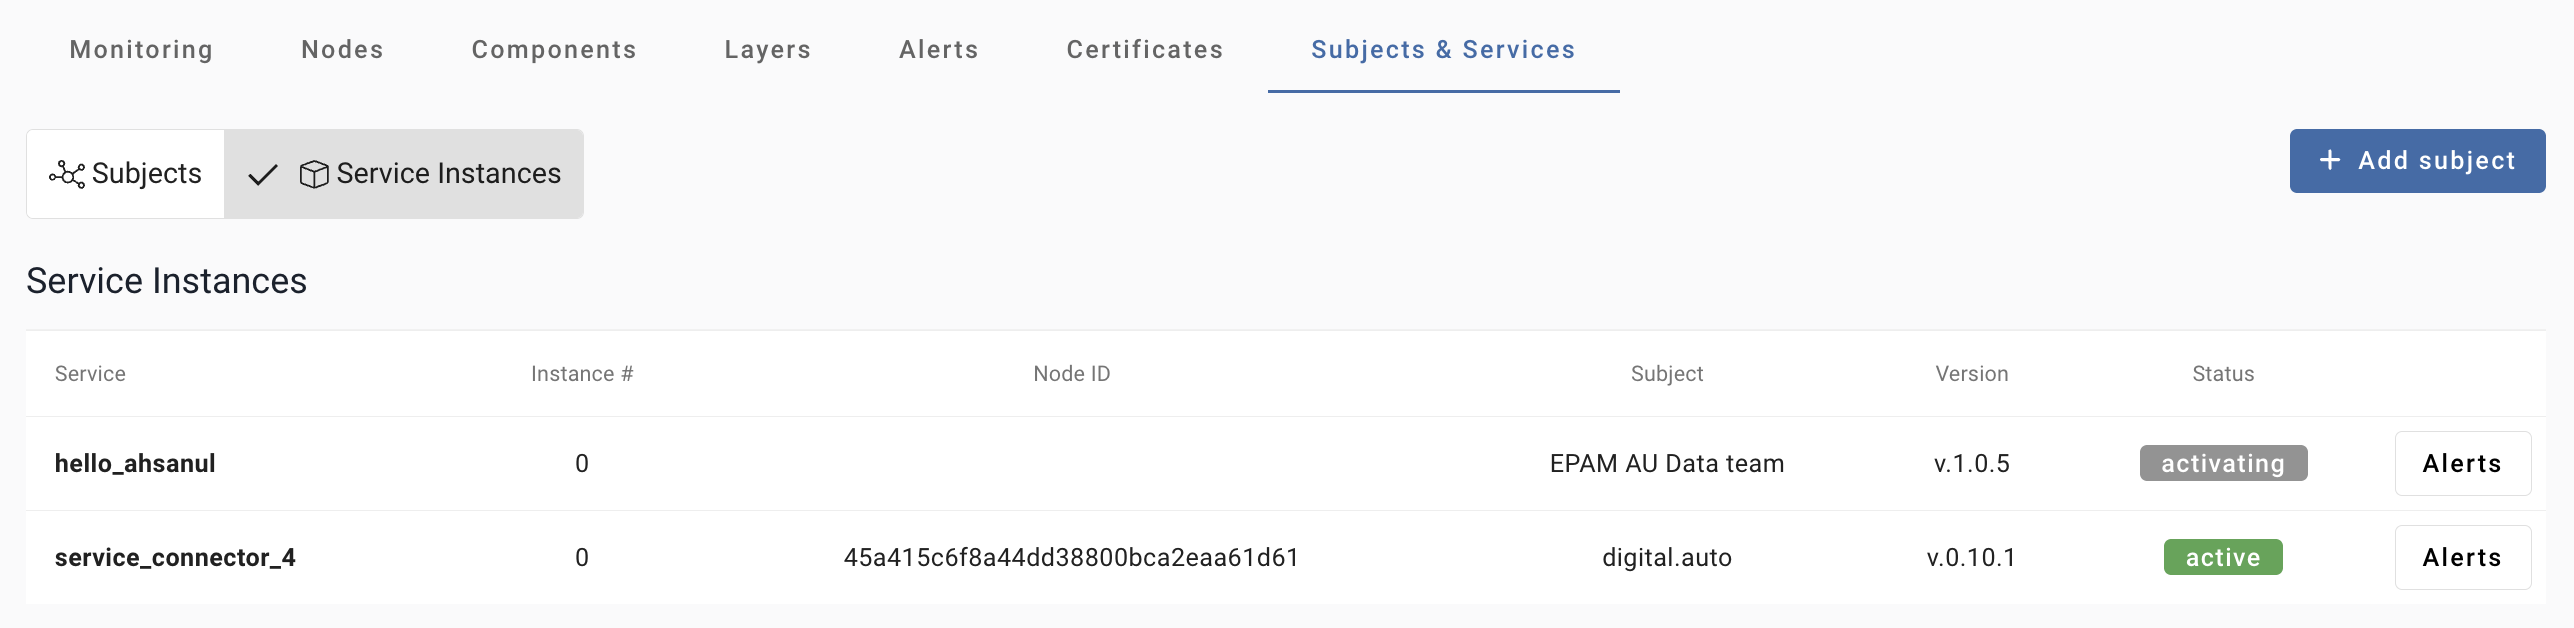
Service Instances
Install status and alerts of Services can be confirmed.
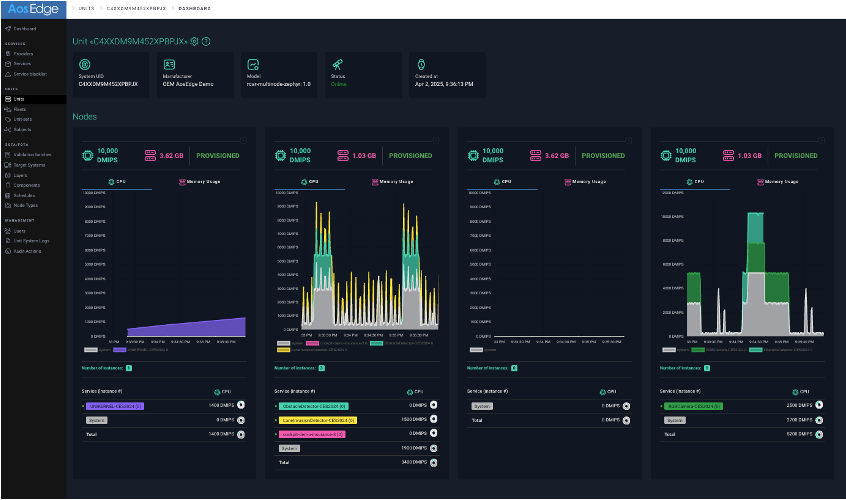
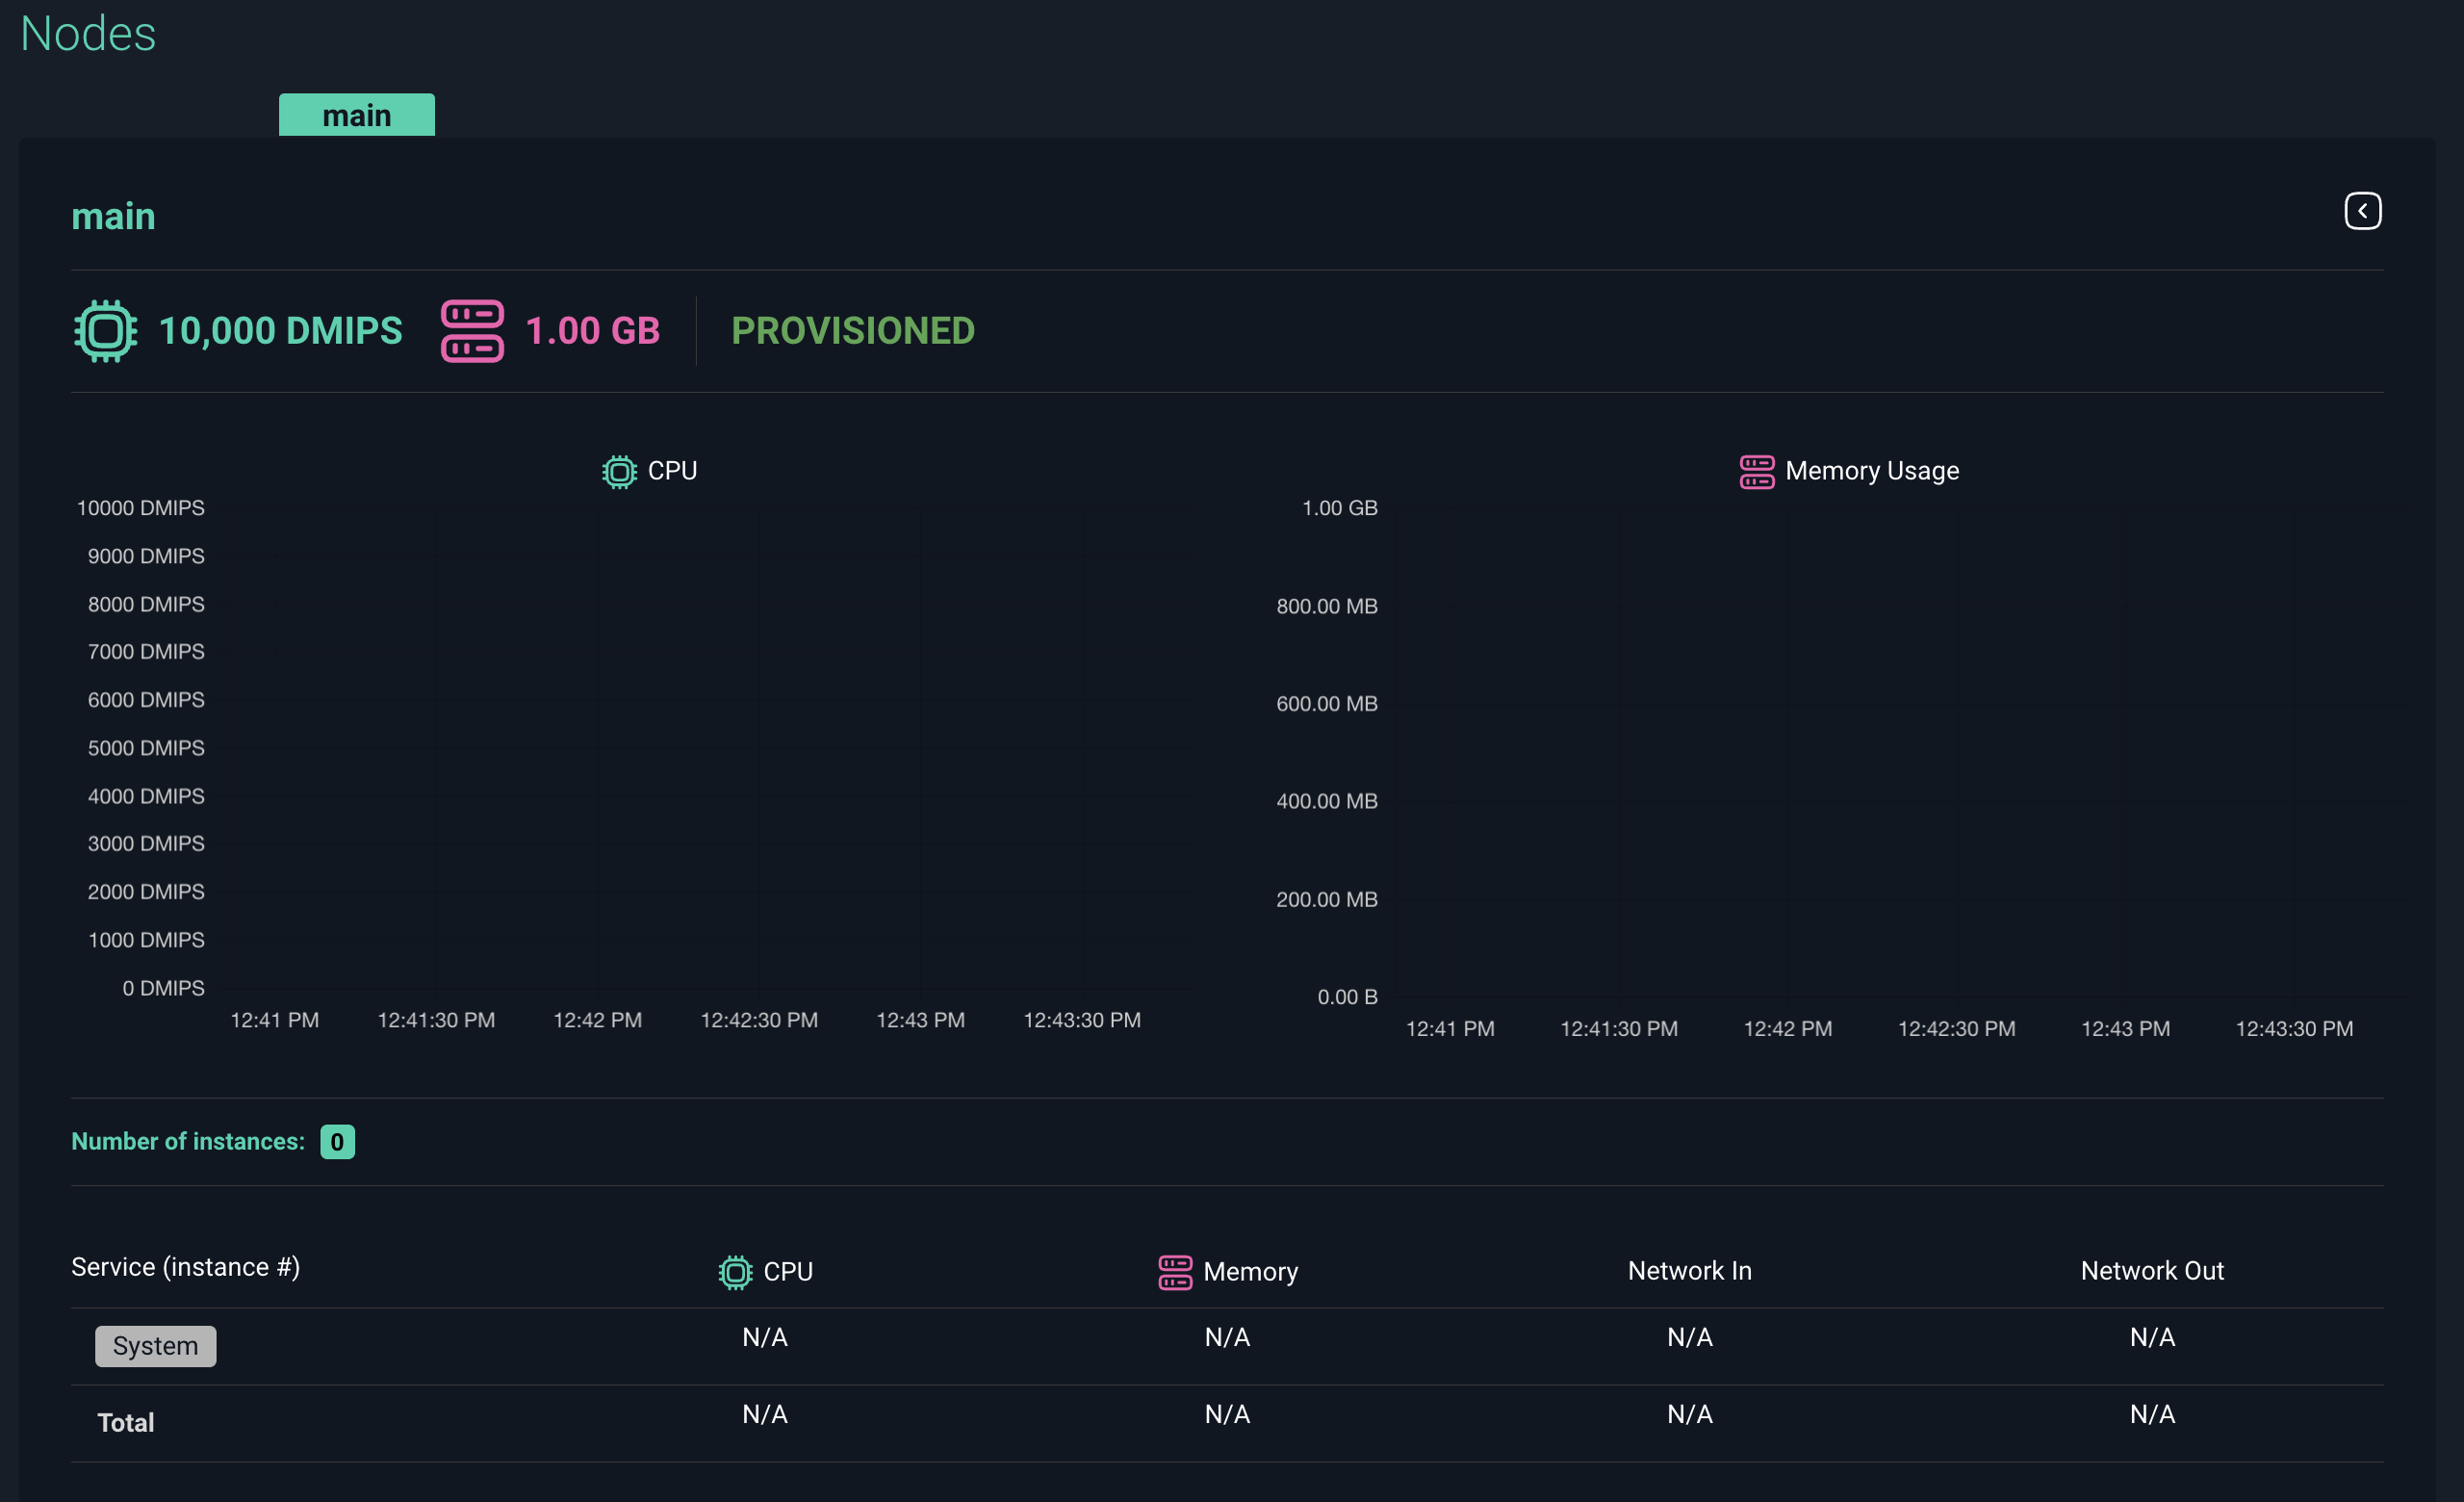
Unit Dashboard page
Each Unit has its own visual dashboard to monitor the unit operation status in realtime.
Click "Dashboard" button under the Unit details.
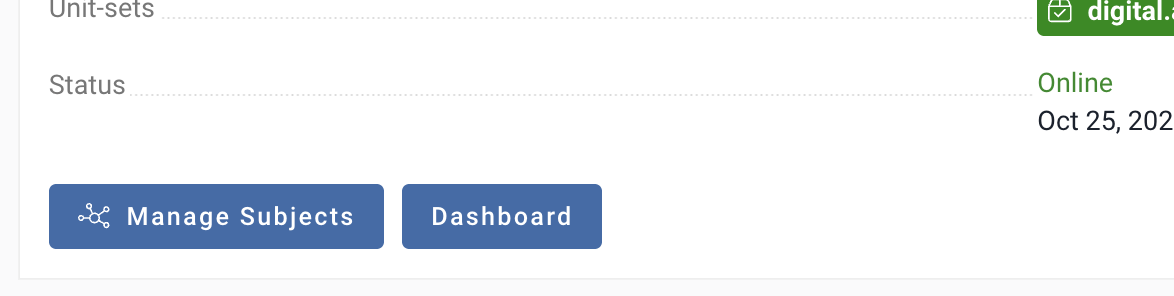
Unit Dashboard page will be shown.
- CPU
- Memory Usage
- Network In/Out
consumed by each Service can be monitored by each node.
(Below example is a multi-node architecture case with four nodes.)
For Network in/out, click the > icon at the top-right of the node graph.
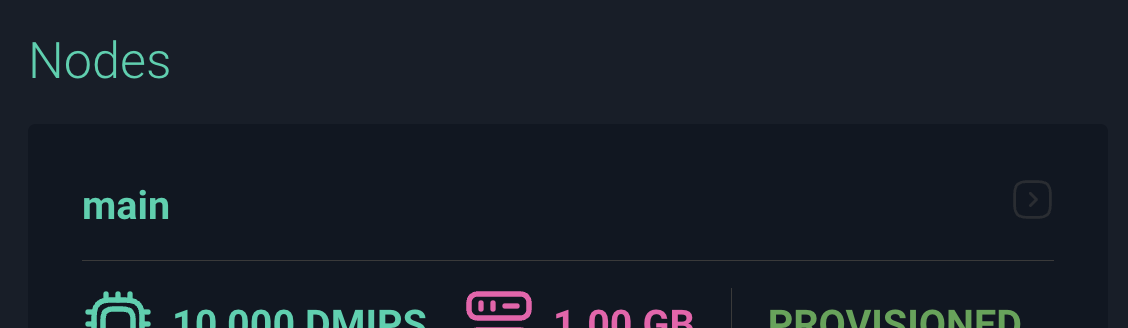
Node graph format will change, and Network In/Out columns will be visible on the list of Services.
Logging
Details of unit behavior can be confirmed from Unit logs. To obtain logs from a Unit, you have below two options.
Get logs directly from the Unit
- SSH login to the Unit
- Start logging via the Unit's system logging feature (ie.
journalctlfor Linux) - Perform your operation
- Collect the Unit logs
See below pages for detail:
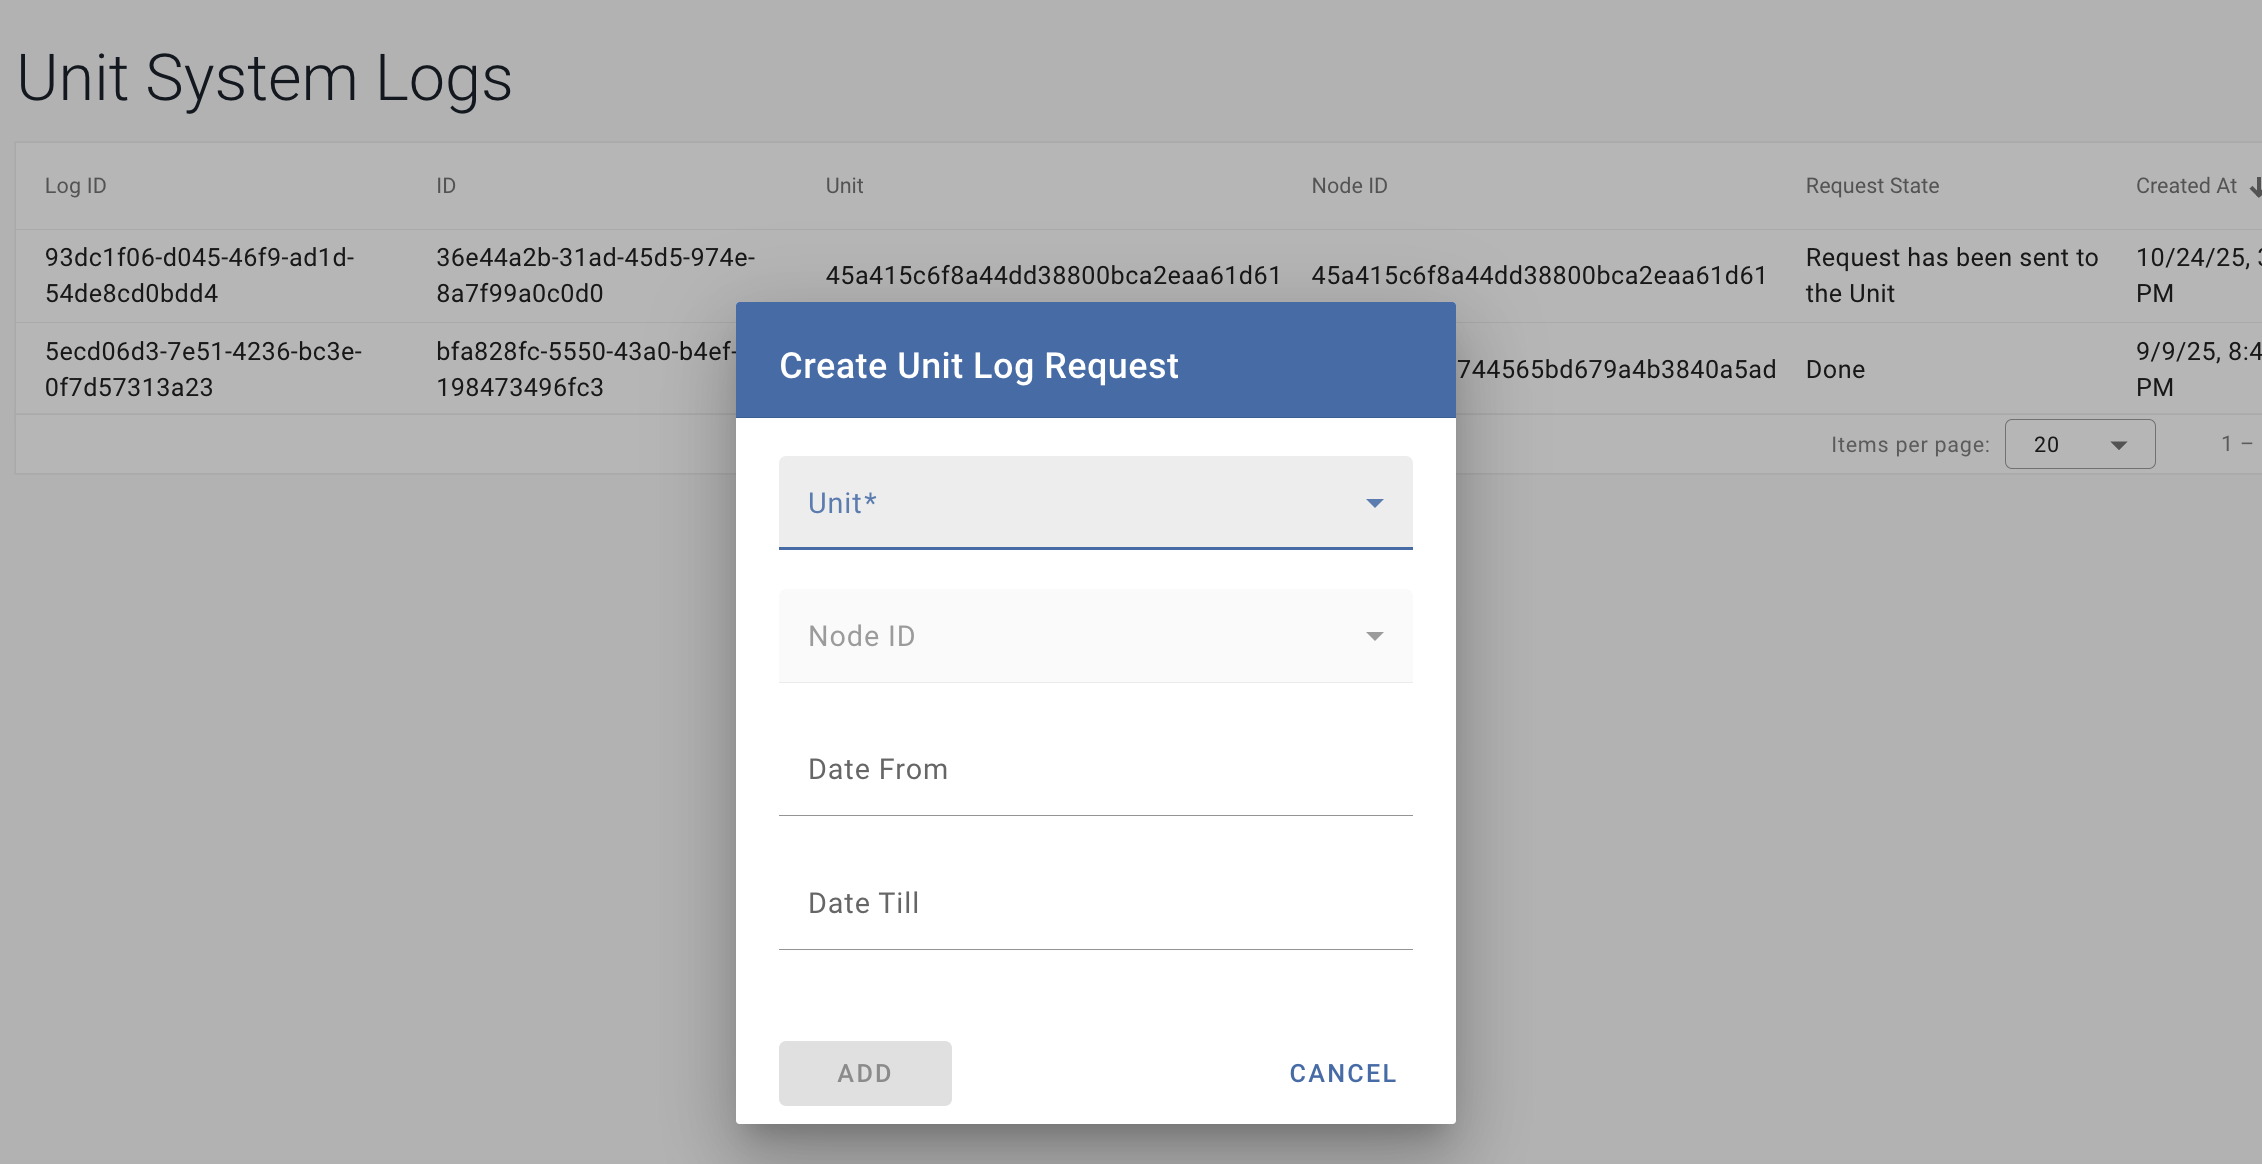
Unit System Logs page
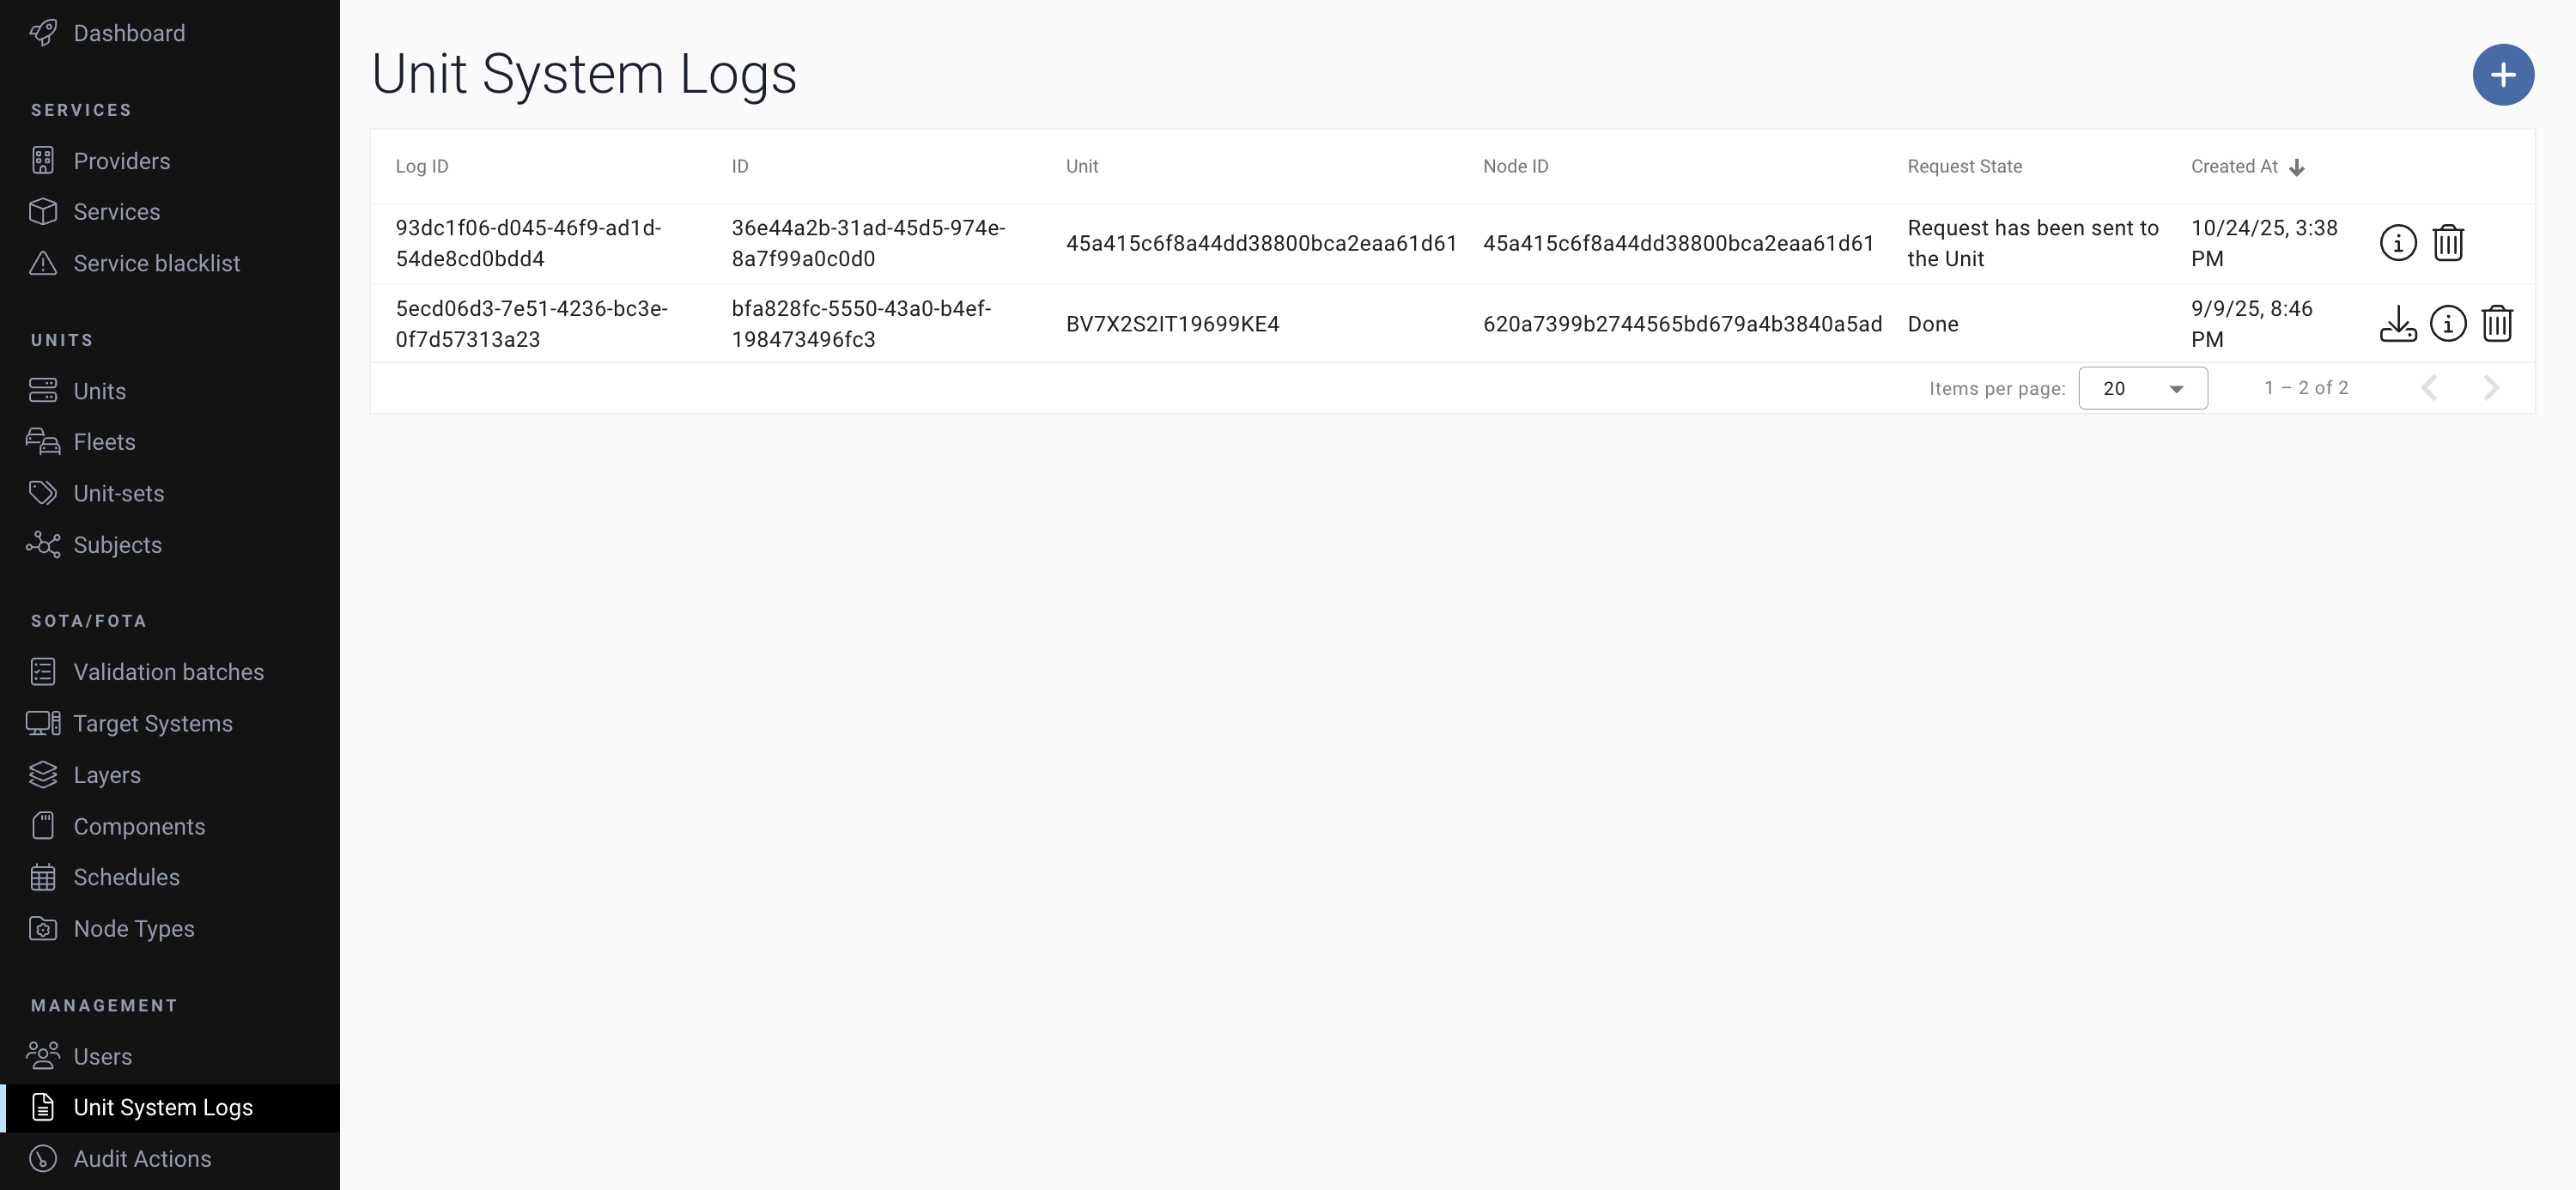
Add your log request to the Unit by clicking the "+" button at the top-right of the page.
When the log file is ready,  icon will appear by the request. Click the icon to download the log file.